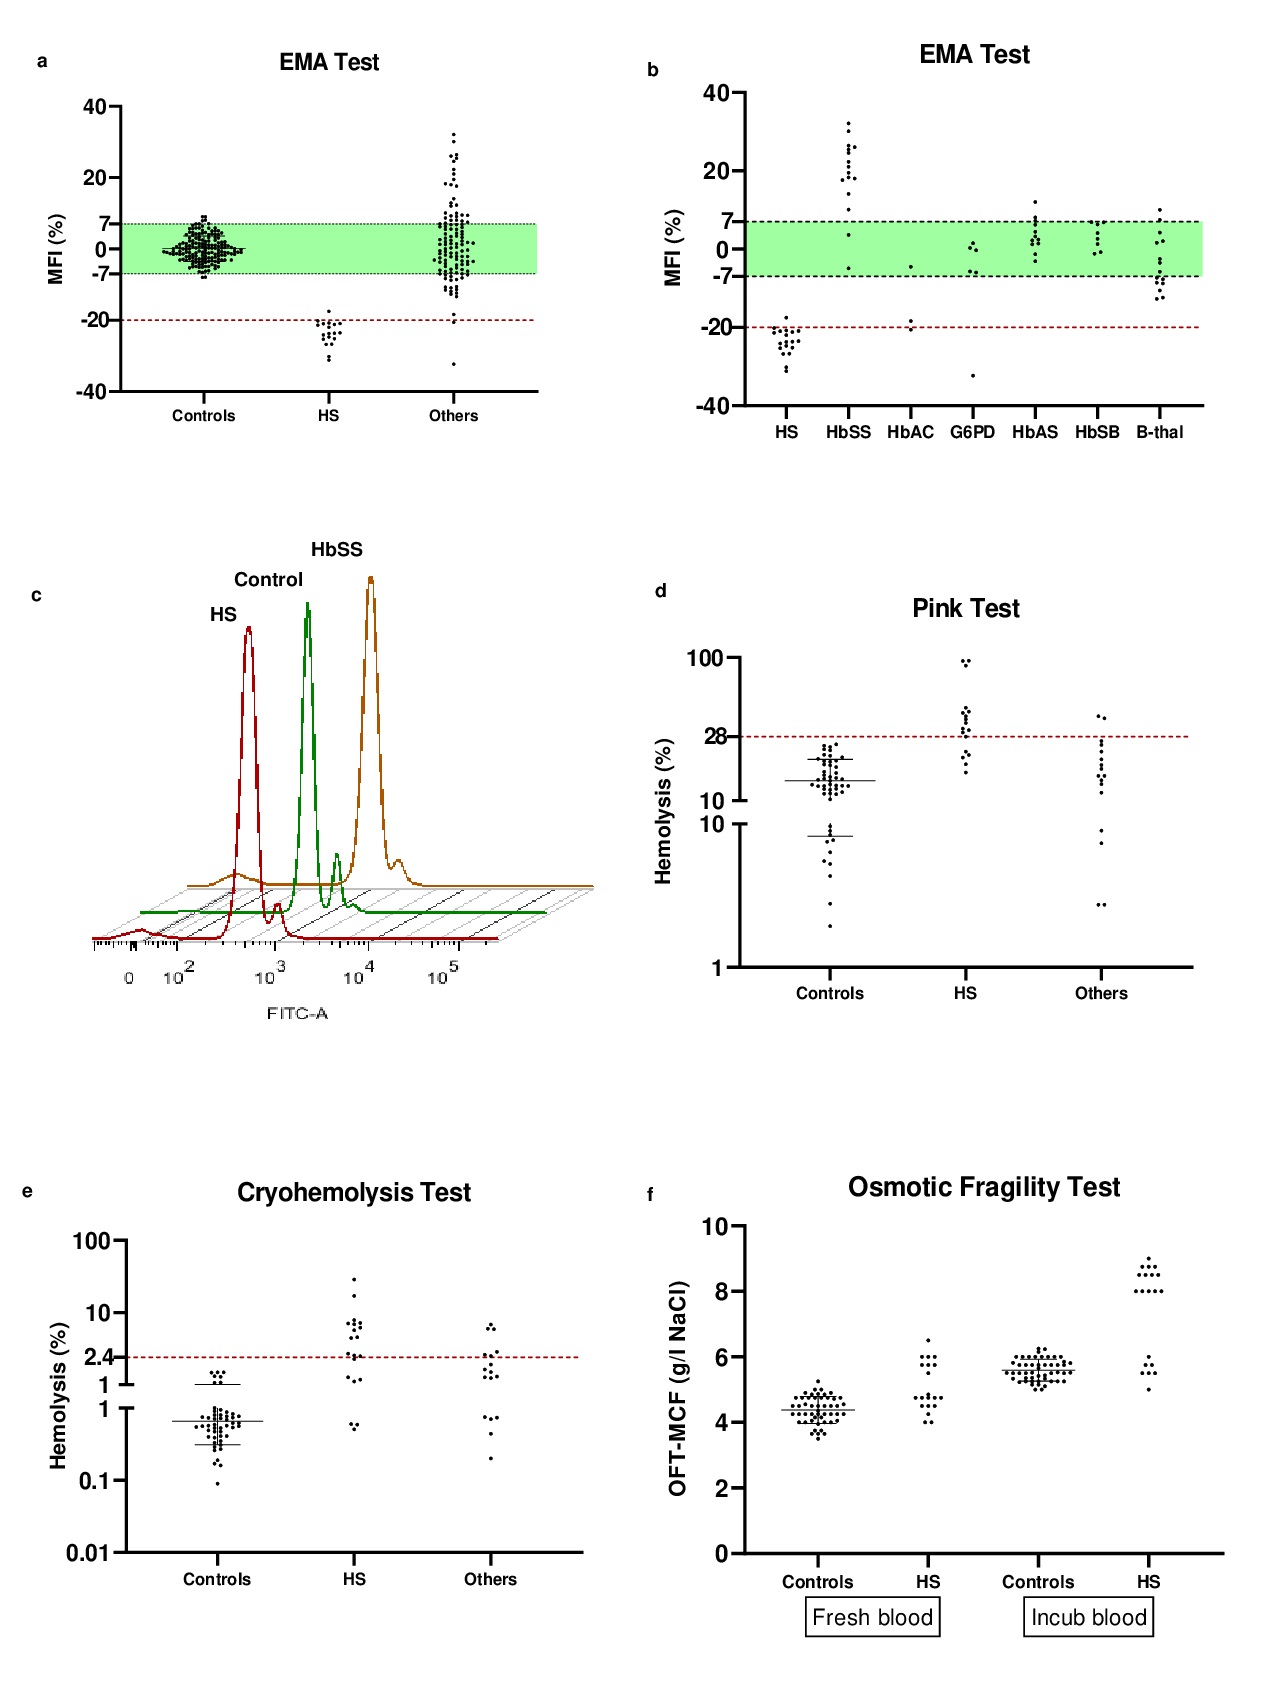
Fig. 1. Results of the flow cytometry analysis of EMA test and the red blood cell fragility tests (PT, CT, and OFT) from patients and controls. EMA: eosin-5'-maleimide. FITC: fluorescein isothiocyanate. FSC: forward scatter. SSC: side scatter. PT: pink test. CT: cryohemolysis test. OFT: osmotic fragility test. HbSS: homozygous sickle cell anemia. HbAS: heterozygous sickle cell anemia. HbSβ: heterozygotes for sickle cell anemia and β-thalassemia. HbAC: hemoglobin C trait. G6PD: Glucose-6-Phosphate Dehydrogenase. (a) Distribution of Mean Fluorescence Intensity (MFI) percentage of EMA dye in controls, HS patients, and patients with other forms of inherited hemolytic anemia. (b) Distribution of MFI% of EMA test in HS patients and the other patients classified according to the type of inherited hemolytic anemia: HbSS, HbAC, G6PD deficiency, HbAS, HbSβ, and β-thalassemia. (c) Histograms of EMA labeled erythrocytes from an HS patient (red), control (green), and HbSS patient (orange). (d, e) Distribution of hemolysis percentage of the PT and CT obtained from controls, HS patients, and other anemic patients. (f) Distribution of median corpuscular fragility (MCF) of OFT on fresh and incubated blood in controls and HS patients.